Algorithm
There are numerous voting systems for single or multi-winner evaluations, but none are designed for massive competitions with hundreds of candidates and partial information, where voters only know a fraction of the candidates.
This article details the algorithm currently in use by the Summer of Math Exposition, along with its explanation and history.
History
Gavel
The first two editions of the competition used a variant of the Bradley Terry model called Crowd BT
The reasons for this choice were two-fold. There was an off-the-shelf implementation that allowed for quick setup, and this system, called Gavel, was already used in hackathons and seemed like a good fit.
The idea is simple: you’re presented with two entries, and a vote consists of choosing the better one. This is called pairwise ranking.
While this was a good starting point, the interface was hard to customize, the algorithm was slow, and most importantly, the benchmark revealed that it wasn’t as accurate as desired.
Expander graph with PageRank
For the third edition of the competition, we decided to redesign the algorithm from the ground up, while keeping the pairwise ranking approach, which seemed promising as comparing two entries seemed easy.
The new algorithm aimed to optimize fairness by building a regular graph with desirable properties (connected, regular, with a small diameter) called an expander graph. This theoretically allowed all entries to receive equal attention and ensured robust flow of information in the graph. I even made an explainer video about this algorithm as part of the competition itself.
Once we have a directed graph with these properties and arrows systematically pointing to the better entries, we can apply a flow of points to find the best entries using the PageRank algorithm.
However, the benchmark revealed that PageRank is very sensitive to noise (errors in judgement, spam, etc.) which can corrupt the result and impair the final ranking.
Benchmark
While developing this custom massive voting system I created a benchmark to better understand the relative performance of these voting systems.
The benchmark’s concept is simple: simulate a vote with characteristics similar to those expected in the competition, with around 500 entries and 15,000 votes. We start by creating a random ranking representing the “true” ranking of the entries. Then, we perform the vote according to different voting systems in an idealized scenario: if entry A has better rank than B (in the “true” ranking) then voters choose A 99% of the time.
This is an “idealized” scenario where almost everyone agrees and votes according to the “true” ranking. In this scenario we expect the inferred ranking from the voting system to closely match the true ranking. To measure this we compare how well the top 10% of the true ranking and inferred ranking overlap.
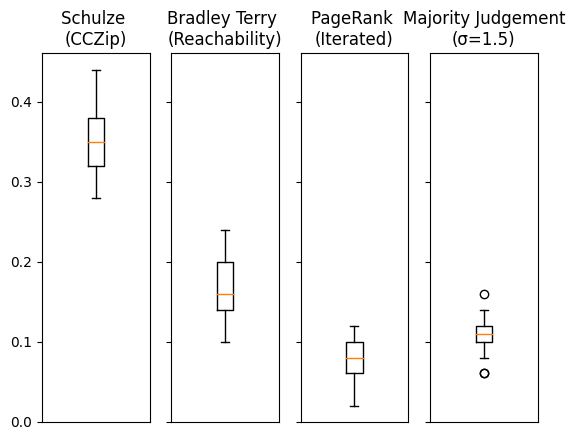
One conclusion of the benchmark was that the Crowd BT algorithm didn’t perform so well.
One interpretation of this result is that the algorithm was designed for crowdsourcing tasks and tries to optimize the results by estimating the reliability of judges. This makes sense in a crowdsourcing context where each judge contributes hundreds of votes (eg. categorizing pictures of cats vs dogs), but not in our massive competition context, where each judge makes only about a dozen votes. Here, information is too sparse to infer judges’ reliability.
Another conclusion from the benchmark is that the PageRank is very sensitive to noise. This is understandable, as the algorithm flows points through the graph, causing noise to flow as well, which can amplify its impact. This also explains Google’s aversion to link farms: because it works and impacts the ranking!
Interestingly, the iterated version of the PageRank is much more robust. In this version, every N votes a PageRank is performed, and for the next cycle of N votes, the pairs of entries to compare are the adjacent ones in the previous PageRank output.
The best voting systems among the ones we benchmarked are this iterated PageRank and the Majority Judgement with about 90% of accuracy on the top 10%.
Majority Judgement
This voting system involves scoring entries individually (rather than using pairwise ranking), and the best entries are the ones with the highest median score.
This approach has many interesting properties particularly due to its reliance on the median. It is not sensitive to extreme votes from absolute fans or spammers, accurately reflects the majority opinion, and is more robust to increased noise compared to PageRank. For instance, if an entry receives a few scores of 0 and 10 but most people rate it a 7, the median score of 7 will be selected.
Moreover, pairwise ranking suffers from several flaws:
- Comparing unrelated entries can be difficult, leading to ties or comparisons that are impossible due to different audiences, topics or prerequisites. This can result in implementation issues, such as disconnected graphs, as well as decision fatigue for voters.
- With entries we have possible comparisons, which dilutes information on the edges and makes these arrows less reliable when using pairwise ranking versus individual ranking with the same number of votes.
- From a user experience perspective, pairwise ranking requires watching two videos before voting, which can be time-consuming (especially if videos are up to 30 minutes long). This may lead to decisions influenced by the more vivid memory of the most recent entry viewed, introducing biais.
For these reasons, we chose Majority Judgement. Our implementation uses a continuous scale, avoiding some edge cases and ties found in the traditional version.
Also the scoring question we use is: “How valuable is this entry to the space of online math exposition, compared to the typical math video you’ve seen?” Judges use five labels ranging from “notably worse” to “better than most”, anchored in the center by “about the same”.
This question explicitly leverages the judge’s experience, and can be viewed of as a pairwise comparison with the judge’s abstract representation of the field, which aligns with our natural way of judging. Another way to look at it is asking for a like or a dislike, but with much more nuance than a simple binary choice. These perspectives make the process feel familiar and intuitive.
Additionally, judges can skip entries they feel unqualified to evaluate.
Overall, this system provides a better experience for judges. They only need to watch one entry before casting their vote and assign a single score based on a natural question, reducing decision fatigue. Additionally, the score aggregation method described here is the most accurate and robust among those we benchmarked.
Optimizing for Quality
One of the goals of the competition is to help people discover excellent science content. While optimizing for fairness like we did in the past is a noble idea, it ultimately overemphasizes entries with no chances of winning by giving everyone the same amount of attention, and worsens the voting experience.
To enhance the voting experience, we decided to filter out entries that have no realistic chance of winning after certain thresholds are met.
This optimization occurs in three passes:
Warm-up Period. Initially, entries are not ranked, so they are assigned randomly with a weighted probability based on their number of votes, promoting entries with fewer votes to maintain balance. Once each entry has about 10 votes, we filter the bottom quartile.
Trend Confirmation. As trends emerge, entries are assigned randomly with a weighted probability based on their median score to confirm their quality. By the end of this pass we filter the bottom quartile again.
Maximizing Utility. At this stage, we have a rough idea of the good entries and want to guide information to where it’s more needed. We apply a visibility boost based on the standard deviation of the score distribution for each entry to see if more consensus can be achieved for entries with large score spread. This visibility boost diminishes as the number of votes on an entry grows, preventing the continued promotion of polarizing entries. For example, if by the time we apply the boost a given entry has 20 votes, the probability for a voter to see this entry will be weighted by the formula:
These optimizations improve both the voter experience and the final ranking, ensuring a more enjoyable and effective competition for everyone.