Complex numbers
Audience:
Tags: complex-numbers
Analytics
Comments
The visuals look really good. It may be worthwhile to state the vertical and horizontal axes of the plot of the Mandelbrot set are the real and complex values of c respectively. I think an introduction to complex numbers should also include examples of how to add, subtract, multiply, and divide so a student can use them. Further, Euler’s formula e^(ix)=cos(x)+isin(x) is not the most obvious result. I typically prove it using Taylor’s theorem but it would be nice to see another approach.
An important topic presented in a fun way. One potential improvement, is that you make numerous references to practical applications of complex numbers, ‘and discover some fascinating applications in … engineering,’ but none are presented. Also, I do think it risks being slightly like an animated textbook chapter, but discussing the Mandelbrot set at the end saves it from that mostly. (side note: the text says the reader can contact you via email at the end, but there no email or clickable link given)
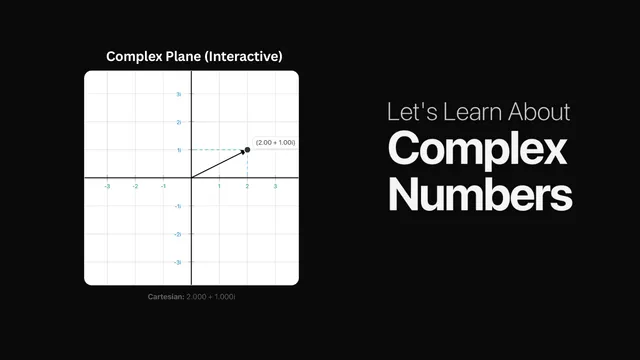
This is an awesome interactive visualizer for complex numbers! I was playing around with it on mobile so unfortunately the functionality is a little broken (had to tilt sideways to properly see visualizations) but even so the visualizations were beautiful and the explanations were excellent. I also really liked dark mode. Well done!
This interactive vector set quickly allows students to lower their anxiety about complex numbers. Good Job!
Such a beautiful and well written piece. The visualization of complex functions just blew me away.
The visualization of basic operations was good, but it missed exponentiation and logarithms. I was not expecting to see functions, let alone fractals in this demonstration. Although they lacked detailed explanations, I think they were presented in an interesting fashion that might motivate the learner to learn more about the topics.
Very nice. The progression through your interactions was very well organized, each step building a little on top of the others. The Mandelbrot set was a good culmination but did you consider the complex Fourier series? (That might be easier to interact with than the Mandelbrot set interaction.)
Great interactivity. Euler’s formula appeared out of nowhere.
That was a really nice, unique exploration of complex numbers. I really liked they way complex functions were introduced and the exposition of different graphing schemes. The hook with Mandelbrot sets in the end was fun but could use a little more explanation. Overall, great job on this one.