A story about Averages
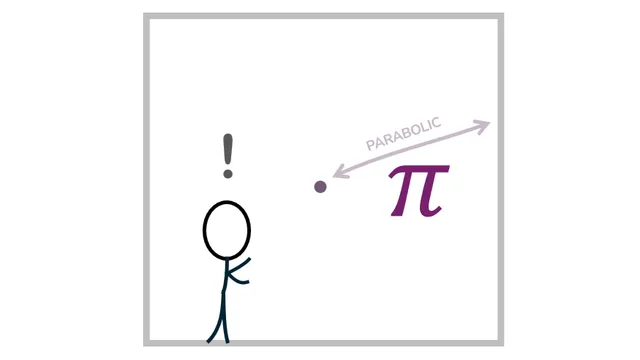
If you measure the average distance between center of a unit square and its boundary, you get exactly equal to P/4. What's P? It's the universal parabolic constant. It's like PI. but for Parabolas.
But why is this problem of averages and squares... linked to parabolas?
Huddle. I have a story to tell you. :)
It shouldn't take long.. about 5 minutes.
Analytics
Comments
4.5
Pointed out some interesting geometric properties, but did not include a proof or even proof sketch justifying those properties (in particular, why the line segments approached a parabola)
7.6
I loved your medium for presenting! It was a beautiful experience. Question: would putting a pause button on the play bar be possible?
The content itself was fascinating. Is there a general rule for which averages take which shapes? Perhaps you could share a link to more formal derivations (if they exist)?
Interpreting averages visually just FEELS powerful. I love it. But what are some examples in which it actually solves a problem?
I enjoyed your presentation so much that my only complaint is wanting more.
4.9
Won't load :-(
2.6
The form factor makes it extremely hard to follow. White text on gray text is extremely disturbing
3.5
The music and animated text were distracting. I feel like this should have either been a regular online article, requiring scrolling down for all the text, or a video with more structured slides.
7.7
Amazing presentation! It would be great if you could tell us why the curves formed are parabolas, cycloids, etc. I really enjoyed this, though :)
3.5
Where is the aha factor also it's more about engineering drawing than math....
5
While definitely there was a lot of work poured into this, I do not like the format. My favorite format is "explorable explanation" (see for example the A* articles by redblobgames, or the bicycle article by Bartosz Ciechanowski). Your format has neither the advantages of explorable explanation (interactivity), a blogpost (you can easily read it at your own pace, for example to skim past things you already know or to stop for a moment to think about the maths yourself), or a video (the support of a big platform such as YouTube).
You have not explained what the "parabola constant" actually is. I have never heard of a "parabola constant" so I expected an explanation here. It would really make the entry better, because I could think myself why this would be the case.
You say "Looks like a cycloid?" and I do see that it is indeed a cycloid, but I doubt that most readers would see this. Either an intuitive explanation or a call to the reader to think about it themselves would be cool. (In a YouTube video you could say something like "tell us why this is a cycloid in the comments")
Otherwise, the explanation was quite good. I like the music.
5.2
Very cool effort!
I'm curious if it could be further highlighted how this format is preferable to a video
4.3
This looks like a really interesting and novel entry, but unfortunately there are some technical issues that drags the score down. First I tried to watch on mobile, but I quickly gave up, as all the text started overlapping, and I had to scroll up and down to see everything that was going on. The experience was better on desktop, but still there were some formulas overlapping with text and some scrolling necessary. I like the idea of animations in the browser, but maybe this would work better as a video?
It was also unclear how exactly the parabola appeared. You started with straight lines, scaled them down, but when you line the segments up you can create any shape you want. Why a parabola?
I hope you keep making these animations, because if you iron out the kinks I think they can turn out really great!
7.2
The animation was engaging and an interesting way to tell the story on how we simplified a problem and got an interesting visualization that seem to suggest a solution. I would have loved to see a more detailed write up after the video supplementing this that went into the more mathematical details to prove that the shape does converge to what we think it is, and why that would be the case.
5.7
This one was rather pretty. Somewhere on the edge between video and text.
7.7
I haven't expected to watch a 'video' in the non-video category.
Though I had known the constant in the last SoME, the animation, which intuitively reveal the link, is still shock me.
7.5
Really incredibly animated. Very well done, although the interface was a bit distracting.
6.2
I think you've done excellent with the presentation. It's as if it's a 3b1b episode yet uniquely styled. However, in terms of math, I'm led to "believe" n=14 is just the right amount, and cannot justify why. Yet, based on this amazing visual, I'd be inclined to accept this for now. If you expound upon how you came up with this value, I'd rate this much stronger. That being said, I hope you keep creating videos because I had not known about the universal parabolic constant. For feedback on the "+1" or consequence topic from this introductory video could be a survey of common applications using the universal parabolic constant. E.g., I'd be interested to see how this applies to a pitcher throwing a base/cricket ball.
5
Very neat concept of an animated webpage! Had a few technical issues: there was some text overlap at the very end and the first set of 6 line segments were drawn too lightly to see.