Summer of Math Exposition
Presented by ![]() 3blue1brown
3blue1brown
Archive
Rank 1
The Science of Complexity
This article takes the reader on a journey into the science of emergence: the study of how simple parts can come together to create complex patterns. It begins with familiar scenes: fireflies synchronizing their flashes, schools of fish flowing as if they were liquid, and magnets uniting countless invisible atoms into a single force. Everyday wonders like these rises a profound question: how does order arise from apparent chaos?
Yet the story goes beyond the phenomena themselves. In exploring the science of synchronization, the article also opens a window onto the making of theory. Science is not just a collection of ready-made answers: it is a process of building models, testing them, watching them fail, and refining them again. Here, the reader is invited to follow that process step by step.
By the end, the article not only explains why such natural patterns emerge, but also offers insight into how scientists think, imagine, and persist when faced with complexity. It is at once a guide to the hidden order of the natural world and a glimpse into the patient, creative craft of theoretical science.
Rank 2
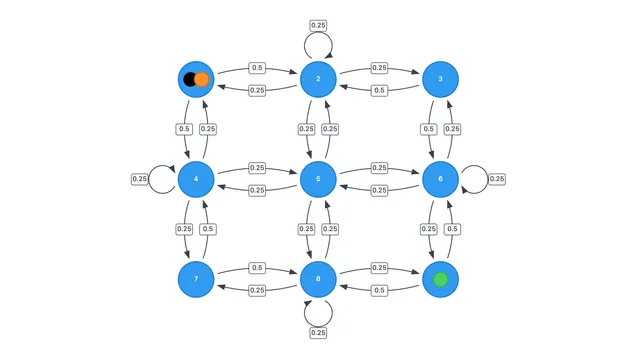
When do Markov chains converge?
The goal of this post is to present some standard Markov chain concepts (specifically, the Fundamental Theorem of Markov Chains) but make them genuinely intuitive through interactive visualizations that let you explore the ideas hands-on. This post is written for undergraduates who have some probability background. You'll get the most out of this if you're familiar with basic Markov chain concepts (states, transition matrices, etc), but even if you're not, the interactive elements should help fill in gaps, and a quick Google search or ChatGPT query can clarify anything unfamiliar.
Rank 3

Curves of Constant Width
A math explainer about 2D shapes with a special property: constant width in every direction.
Rank 3

Metric Spaces
This website is a visual and interactive exploration of metric spaces, intended for a broad audience. Anyone somewhat comfortable with high school algebra should be able to follow along and enjoy a new and exciting field of mathematics. Those with prior experience will hopefully enjoy the visualization and strengthen their intuition. Enjoy! :)
Rank 4
Music in Even Parts
Interactive article that explains euclidean rhythms
Rank 5

The Infinite Faces of Infinity
What if I told you that there are different sizes of infinity? In this article, we will discover how deep this rabbit hole goes and what implications it has for mathematics.
Rank 6
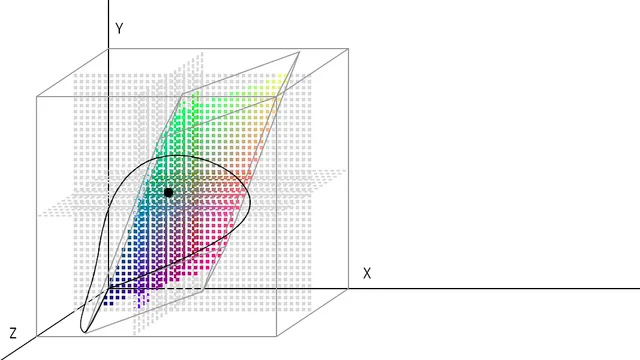
Quantifying Color
This is a post on different ways of quantifying colors, and in the process understanding the relatively popular CIE xy chromaticity diagram, or the 'horseshoe color diagram'. Also touches a little bit on color blindness, and why 'the dress' looks both blue and black, and white and gold.
Rank 6

Introduction to Solving Ordinary Differential Equations Numerically
This is an interactive notebook that provides an introduction to solving ordinary differential equations (ODEs) numerically.
We first discuss how ODEs can help us predict the future and how they are defined. After that we look into slope fields to get a qualitative idea on how the solution to the ODE behaves. From there, we will develop the Euler method for solving ODEs numerically and look at three different interpretations of Euler's method, which give us insight into how to design the parameters and develop improved methods.
The intended audience is everyone who wants to get an intuition on how ODEs are solved numerically. The entry is probably suitable for high school and undergraduate students.
Rank 7
ProveIT
ProveIT is a short game which will help you learn how formal proofs work in Logic.
In ProveIT you start with a set of Given Statements. Your goal is to Prove a certain new statement using Rules of Inference. As you progress you will come across new Rules and complex levels. Complete all levels to get to know the Axioms of Logic.
A handy journal is included to help you understand rules if you get stuck.
If you cannot play the game or you find the game is too long to judge, consider looking through the full downloadable journal to see what rules are introduced in the game.
The game works only on PC (using a mouse is recommended but not required), and no downloads are required.
Rank 8
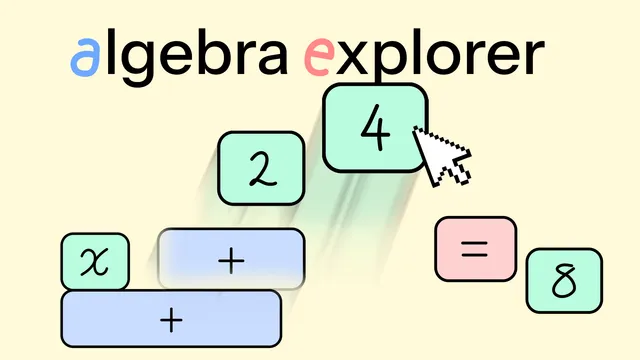
Algebra Explorer
A tool to help students explore algebra without worrying about making mistakes.
Rank 9
Using Möbius Maps to Manipulate the Complex Plane
As with all olympiad addicts, when I started university maths, I had to deal with a massive wave of depression when I realised that all those years I spent learning olympiad tricks, theorems and techniques, were useless. "I'll never need cyclic quadrilaterals again", I thought.
Even worse, Euclidean geometry was my favourite subject - but it seems to vanish off the face of the earth as soon as high school finishes.
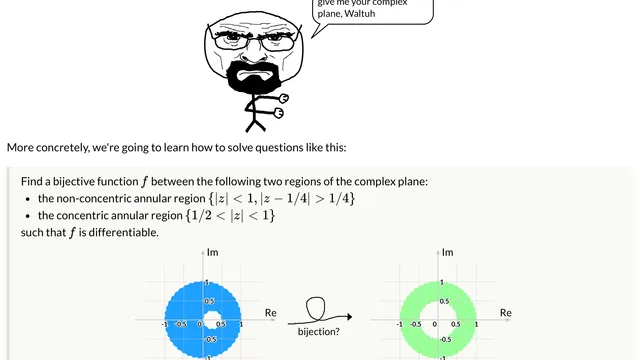
Well, this all changed in my second year of university, when I took a complex analysis course that BLEW MY MIND. It made me realise that olympiad geometry has a use after all! There's a beautiful concept in complex analysis called a Möbius map, and it turns out to be very similar to olympiad inversion (if you know what that is). Today I'll do my best to build the intuition from the ground up.
I'm going to teach you how to use Möbius maps to beat up the complex plane like it owes you money.
Rank 10

Discovering Productive Numbers
The website is focused on explaining, from scratch, the main ideas of an alternative way of axiomatizing the natural numbers call productive numbers. Beginning with the basics of factorization and logic, the book very gradually builds up to the formal definition of productive numbers. After exploring some examples, it proceeds to give an intuitive proof of the first theorem: an elegant bijection with the natural numbers. The following sections introduce some binary options, a partial order and prove these form a distributive lattice.
While the actual content of productive numbers probably not going to be particularly useful to students, the goal of the book is to give an engaging portrayal of how new mathematical concepts are discovered. There is a very deliberate emphasis on intuitive explanations throughout as well as some personal anecdotes about how and why certain decisions were made.
Many curious students are put off by the strict formality of mathematical writing, leading them to believe they could never understand things in such a way (or at least I have met many such people). My greatest hope for this book is that the reader comes away thinking “that’s so easy! I could have thought of that”
Rank 11
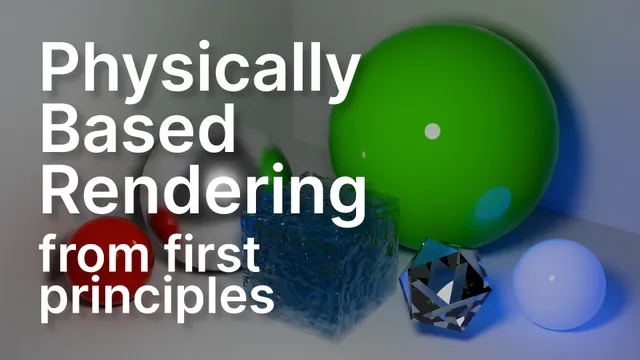
Physically based rendering from first principles
An interactive article exploring the physical phenomena that governs how light behaves and interacts with matter to make a PBR renderer
Rank 11

Bayes, bits & brains
This is a website about probability, information theory, and how they help us understand machine learning in particular, and the world in general.
The main prerequisite is knowing probability on the level of a standard introductory course. Some more advanced parts of the site also assume some knowledge of statistics / machine learning, mostly to appreciate the context.
The site takes a nonstandard approach to expose the topics: heavy on hands-on widgets and light on proofs.
I would be grateful for your feedback! Apart from SoME feedback form, you can use the button in the bottom-right of the page.
AI was used heavily in all kinds of ways to create this website.
Rank 11
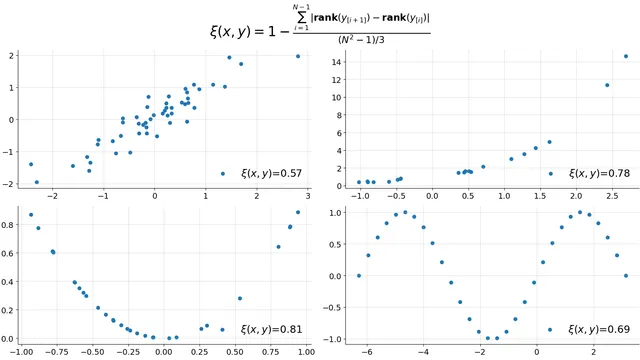
Chatterjee's Xi Coefficient
This blog post explores an elegant and surprisingly recent measure of correlation developed in 2019. We'll see the intuition for this new formula and how it compares with other measures of correlation we're more accustomed to in an introductory statistics class
Rank 11

But can I really solve this equation?
Just another Galois theory intro... Or not?
I wanted to show that there's no general solution for the quintic equation, the same way as Galois himself did it in his original memoir. Sometimes, the original work provides the best intuition, far from the modern jargon necessary to make everything more general and rigorous.
I didn't have time to write everything I wanted. As a result, I'm submitting what I currently have, which is only the first half, but I think it's already long and useful enough, so probably worth submitting.
Rank 11

An Impossible Problem
A Math Interactive about Ship, Bombs, Infinities and Failure.
(Choose "Hide Control" for full-screen view)
Rank 11
Mathematics: In Sound Only! Logarithms
I have created an audio program intended for an enthusiast audience, using the logarithmic perception of pitch as a metaphor to explain logarithms and the exponential function. My intention is to explore sonic metaphors, which I feel are underused in maths education, and to attempt to improve access for blind and partially sighted people.
Rank 11

Video Game Blurs (and how the best one works)
How to build real time blurs running on the GPU and how the best ones work - An interactive Article about the intersection of graphics programming, maths and the chase for real time performance: With many interactive visualizations to guide us, we’ll journey through the world of blur algorithms, make a detour through frequency space manipulations, torture our graphics processor, before finally arriving at an algorithm, born from years worth of graphics programmer research, experimentation and sweat - The ✨ Dual Kawase Blur 🌟
Rank 11

Complex numbers
This interactive guide invites everyone-from curious learners to high school and early undergraduate students, programmers, and math lovers-to discover complex numbers with no prior background required.
This blog is all about complex numbers and its visualizations so in this you will explore
Basics: Understand how numbers like 3 + 4i consist of a real and an imaginary part.
Complex plane: Drag a point to see how real (horizontal) and imaginary (vertical) components behave.
Addition & subtraction: Visualized as vector addition-move two points and watch their sum appear dynamically.
Multiplication: Revealed as rotation + scaling; adjust magnitude (set to 1 for pure rotation) and angle (set to O for pure scaling) interactively.
Cartesian Polar & Euler's formula: Toggle between forms to experience in real time.
Complex functions: Watch transformations of the plane by functions like,, and-grid warping, doubling angles, inversion, spirals!
Mandelbrot set: Zoom into mesmerizing fractal detail. Colors indicate escape speed, while black denotes bounded points.
Who it's for:
General learners, with no math prerequisites
High school & undergraduate students exploring beyond the curriculum
Aspiring engineers, programmers, and math enthusiasts who thrive on visual, hands-on learning
Rank 12
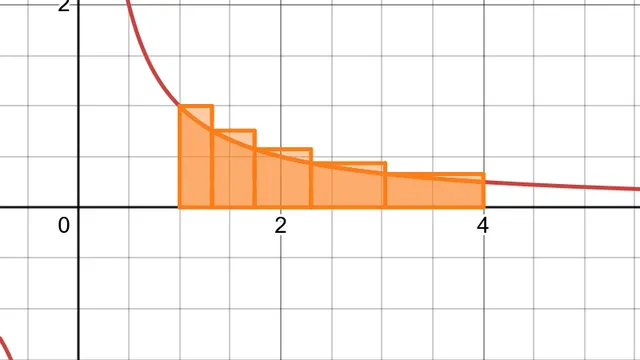
The Quadrature of the Hyperbola
An article about integrating the function y = 1/x from first principles. 30 pages. Aims to give an intuitive and engaging explanation of why the natural logarithm is the measure of the curvilinear area underneath a hyperbola, with plenty of diagrams. Presupposes knowledge of arithmetic, algebra, and coordinate geometry; delves into elementary calculus.
Rank 13
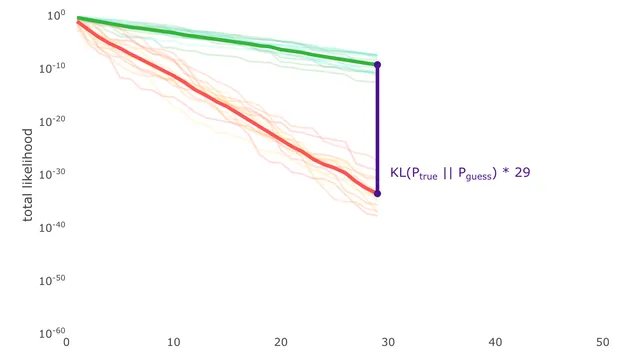
KL Divergence Explained Visually
KL Divergence is a beautiful but very irritating concept. I spent a year struggling with the intuition and months working on a write up. Then, I realized one visual could capture it all!
Your feedback is super valuable to me. I want to make this article/visual worthy of Wikipedia, and I need your help to do it. Looking forward to your suggested improvements >:).
This work is partially inspired by:
1. https://www.youtube.com/watch?v=SxGYPqCgJWM (by Aidan Liusie)
2. https://www.lesswrong.com/posts/no5jDTut5Byjqb4j5/six-and-a-half-intuitions-for-kl-divergence (by Callum McDougall)
Thank you in advance!
-Carson
Rank 14

If you can read clocks, you can understand binary and hexademical numbers
I tried to come up with a more intuitive explanation for positional notation, using analog clocks as substitutes for the digits. The visualizations of article are interactive, so you can play around to see the values change on the clock faces themselves, which hopefully helps with giving people a feeling for the system.
Along the way I share some musings on positional notation being a form of data compression, and how this data compression also allows for faster calculations of bigger numbers. Even if done by hand by humans!
While I wrote the interactive notebook with a teenage-or-older audience in mind, I suspect the visualization and core idea for the explanation itself could work for elementary school children too.
My motivation behind it was my own memory of feeling incredibly frustrated with how binary numbers, hexadecimal numbers and positional notation in general was explained to me as an undergraduate. Even more so after I understood them and realized that the whole idea was much simpler than the explanations made it appear.
Rank 14
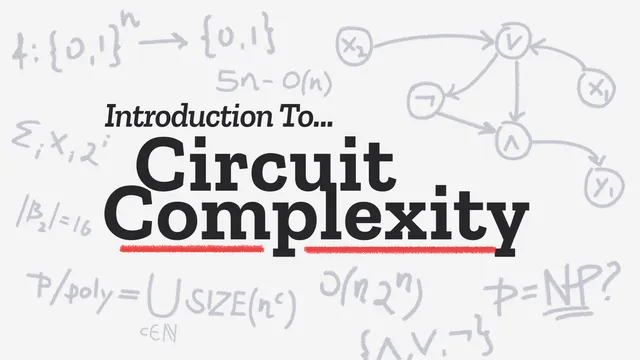
Introduction To Circuit Complexity
A look at the importance of circuit complexity, main results, and how it shapes cryptography, complexity theory, and our grasp of the true limits of computation.
Rank 15
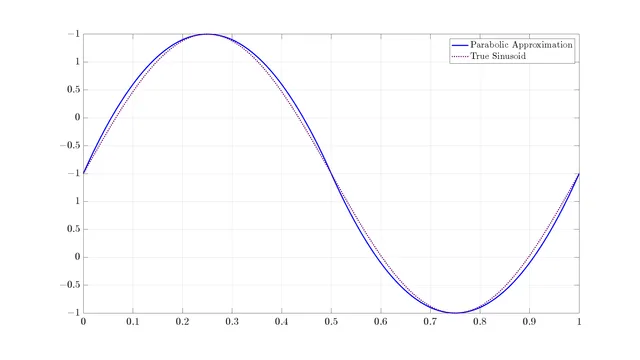
Parabolic Approximation of a Sinusoid
A sinusoid looks quite similar to a series of truncated parabolas of alternating vertical orientation. In this blog post, I show how we can quantify how similar they really are, and then I demonstrate the implications of the differences.
Rank 16

How Infinity Hides Into Your Algorithms: The Power of Pigeonhole Principle
“You cannot put 10 socks in 9 drawers without something overlapping, obvious right? But this trivial fact lets you prove infinite truths, detect collisions in cryptography, and defeat compression algorithms.”
At first glance, the Pigeonhole Principle (PHP)—“if you have more pigeons than holes, at least one hole must contain at least two pigeons”, feels like a Kindergarten observation. But, it is no longer just a drawer problem. This is a gateway to infinity, impossibility, and inevitability- all hidden in a childish fact. Let us unpack how this humble principle sneaks into algorithms and mathematical truths.
Rank 17
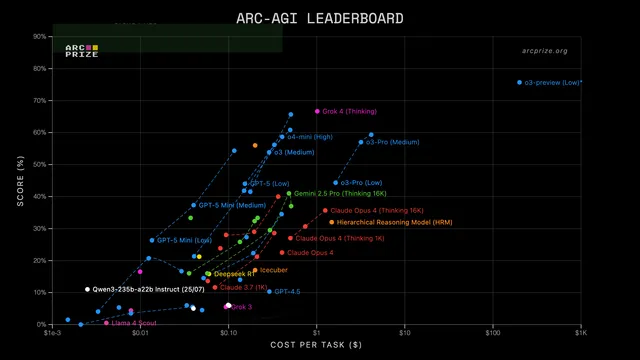
The One-Parameter Model That Broke ARC-AGI
I built a one-parameter model that gets 100% on ARC-AGI-1, the million-dollar reasoning benchmark that stumps GPT-5. Using chaos theory and some deliberate cheating, I crammed every answer into a single 864,000-digit number.
Rank 18

Entropy of a Mixture
How can you interpret the entropy of a mixture of probability distributions?
Rank 19
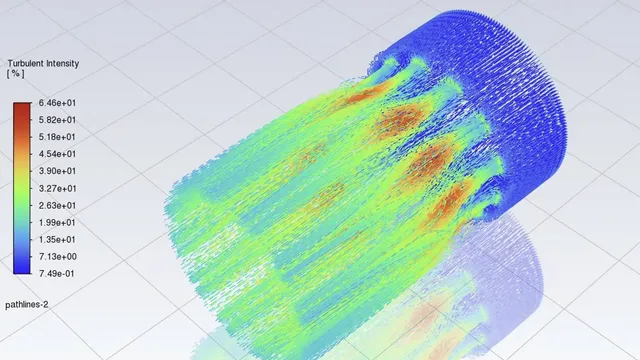
Computational Fluid Dynamics, As You Like It
Click on the image below to access project!
Computational Fluid Dynamics, As You Like It is an explainer that details the theory behind the CFD programs that are used by the biggest engineering companies at three different levels. It explains it using analogies at an "intro-physics" level, without any calculus, an "AP" level, with some physics and calculus, then an "all out" level, with multivariable calculus, linear algebra, and full fluid and thermo dynamics theory. It explains every step that the program goes through to take a fluid region and determine the pattern movement of the air through that region. It includes a simple 2D-CFD solver for an interactive demonstration of the equations learned. Using everything from sports analogies to the volume integral divergence theorem, this explainer makes CFD accessible to aspiring aerospace and mechanical engineers at all levels.
Rank 20

Using Geometry, Quadratic Functions, and Calculus to Prove Why You Should Balance Scoring & Retrigger Effects In Balatro
A look at a specific behavior in the video game Balatro, including its mathematical properties, and a proof on how to get the best score using this behavior.
Rank 21
Stocastish Gravity
This interactive article uses particle simulations to explore ideas of gravity and time dilation. It explains how the simulations have been designed and provides the reader with parameters that they can change in order to customize the simulation and observe the new behavior therein. The intent is for this to be a useful tool to inspire the reader to explore whatever flights of fancy or silly ideas they might have using programming. As such, it is not mathematically rigorous but focuses more on a general audience with some coding experience.
It touches briefly on computer science topics like asymptotic analysis, multi-threading, and how those two concepts may give rise to unintended side effects. Code snippets are presented to give readers some insight into how the simulations were created and why certain approaches were taken. As the simulations run, statistics are graphed to build to a larger point about how parameters of the simulation can be changed to introduce gravity without changing the forces on the particles.
Rank 22
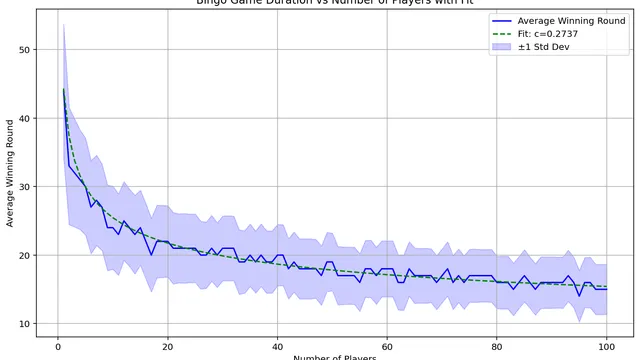
How Long Does a Bingo Game Last on Average?
Simulations of probabilistic games are important stepping stones in statistics and computer science. This submission explores simulations through asking questions about the game Bingo. The submission will walk through the ideas around the simulation, including classic chestnuts like the law of large numbers and trend analysis. One place where I feel this differentiates itself is incorporating the tools of curve fitting to finding a final solution to the problem. This type of problem is usually explored at the end of high school or the beginning of college and can be used after understanding simulations of simpler events like dice rolls but before studying non-probablistic games like checkers or chess. While this is not a lesson plan, per say, I enjoy writing in a conversational tone that may allow this to be used as an outline for a talk to an audience familiar with some of the background information.
Rank 23

How information can confuse you — the secretary problem
Solving real world problems by constructing probability arguments
Rank 24
Regressions: The Math Behind The Magic
In this article, I explore the widely used concepts of regression analysis and take a deeper dive into the mathematics behind it.
Rank 25
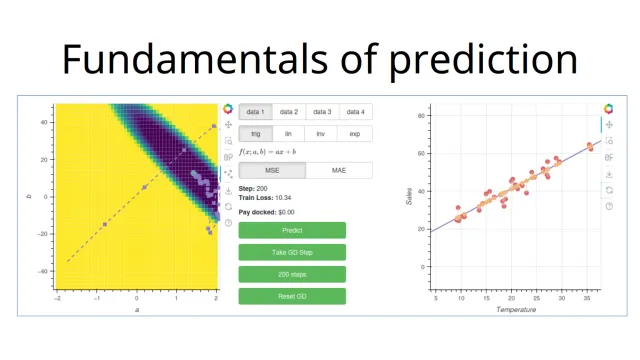
Interactive introduction to prediction
Hi all,
I've written an interactive blog post with a basic introduction to prediction in Machine Learning. This is a topic that I covered in depth somewhat-recently in my masters degree and I feel like the textbooks didn't work very hard to provide the "click" moment. After the click came, all of the maths made much more sense. I think that videos and interactive figures are a great way of bringing across this intuition.
I'm really trying to reinforce the flexibility. You don't have to use one of the standard models, like neural networks, gradient boosting, linear models etc. It is possible to make up your own model that fits your problem and then figure out how to train/optimise it. The models that we have exist for a reason. They're good all-rounders. We know how to optimise them. But often, especially when you don't have much data, making something bespoke is the way to go.
I've also tried to emulate Grant's approach to teaching, where the learner should feel like they've discovered something themselves along the way. I want to introduce the problem of prediction as something you *could* do by hand, but that it's better and easier to pass it over to an algorithm.
I've also tried to keep the formal and informal parts separate. There's more background in the footnotes for those that would like to have a more structured description of the ideas.
I'm not a teacher, so one of the hardest parts was imagining my target audience and what they might struggle with. I believe that this might be useful for advanced high school students and early undergrads. Any feedback on anything that is too easy or too hard given this audience would be much appreciated!
Thanks to you all for your part in making maths a little more beautiful and intuitive!
Cheers,
Jason
Rank 26
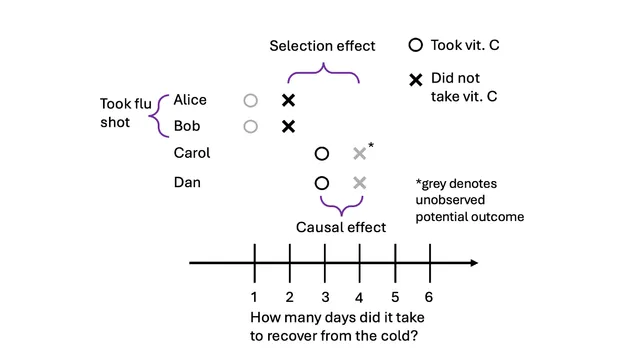
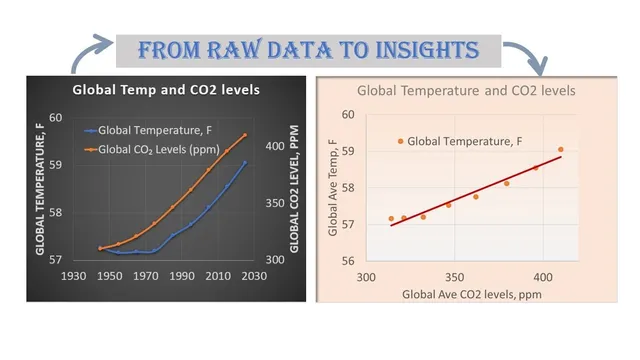
Causation, Correlation, and Confounding: A Graphical Explainer
I illustrate causation, correlation, and confounding using what I think is a new graphic. We'll start by defining causality in terms of potential outcomes and introduce the fundamental problem of causal inference. Then move on to correlation, defined to focus on how its calculated using observed data. I'll then show examples of correlation without causation (i.e., confounding), and causation without correlation(!). We'll briefly cover why randomization is important, and end with some advanced topics on heterogenous treatment effects and SUTVA violations.
Rank 27
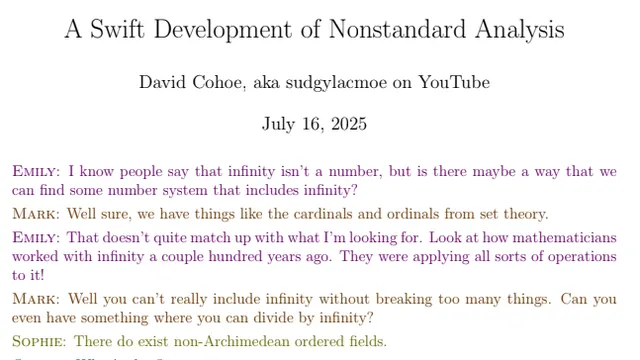
A Swift Development of Nonstandard Analysis
This document is a development of nonstandard analysis. However, instead of being written in a traditional, expositional format, the development is done through a discussion involving several characters who are trying to figure out the topic for themselves. While I do care about the topic and hope you learn a lot through what I wrote, my primary purpose in writing this is to highlight this conversational approach to mathematical writing.
Rank 28
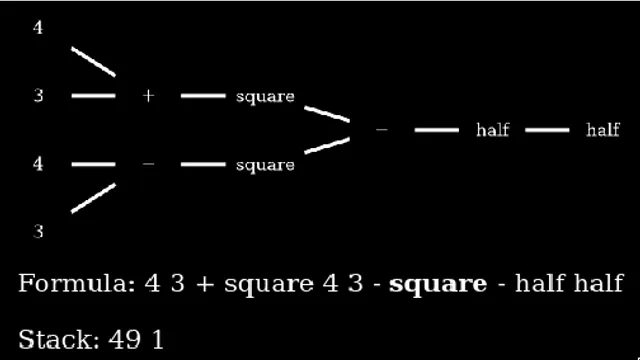
Postfix, infix, and the nature of syntax
What is postfix? How could it be better? Why don't we use it more?
Rank 29
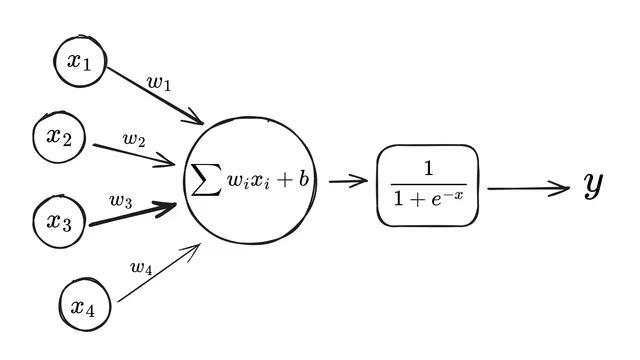
The Fundamentals of Machine Learning
The last few years have brought us incredible advancements in machine learning. These diverse systems are built from a few core building blocks, which are modified and combined in complex ways.
These core ideas often get abstracted away when discussing the bigger picture, which leaves us to wonder — “What’s going on inside?”
In this interactive lesson, we will answer that question by thinking small.
We will start with the simplest of models — The Line, and see how it can help us build a Neural Network capable of learning anything. Then, going back to the line, we will learn how to train it using the Gradient Descent algorithm, which we will write from scratch in Python.
Audience: learners who have a base in calculus (differentiation) and some prior programming experience, who wish to learn machine learning practically.
Rank 30
Relativistic Raytracing
In this article I show how to render a physically accurate black hole, in full compliance with General Relativity.
In order to do that, we'll derive motion equations for light rays, implement Runge-Kutta integrator in GLSL, and finally combine the two into a fragment shader that traces the light rays emitted from the camera into the past.
Rank 30
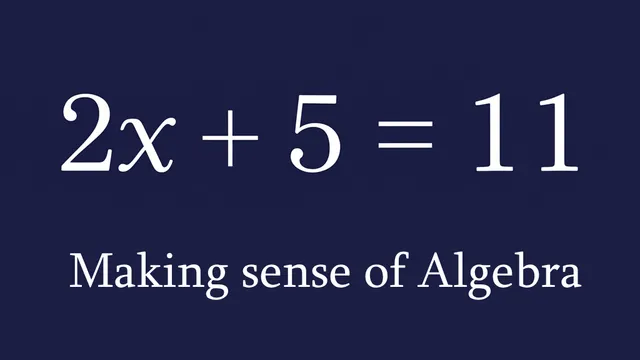
Making Sense of Algebra
A 15 minute blog article explaining elementary algebra to a general audience. The focus is on a deeper insight into what the topic is all about, and it is intended to be a first pass introduction into the thought process of solving algebraic problems, and how we might come up with these kinds of solutions ourselves.
The reading level makes it most suitable to highschool teens, and adults who are interested in math but have no background in it.
Rank 31
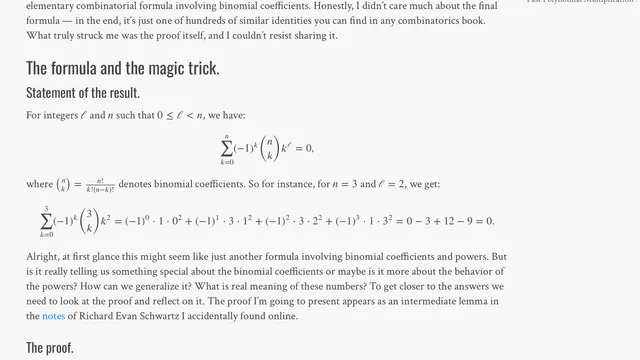
In Mathematics Proofs Sometimes Matter More Than End Results
A short blog post illustrating mathematical thinking through proofs: starting with a simple combinatorial identity, we reflect on the proof and gradually generalize it step by step towards a q-analogue.
Rank 31
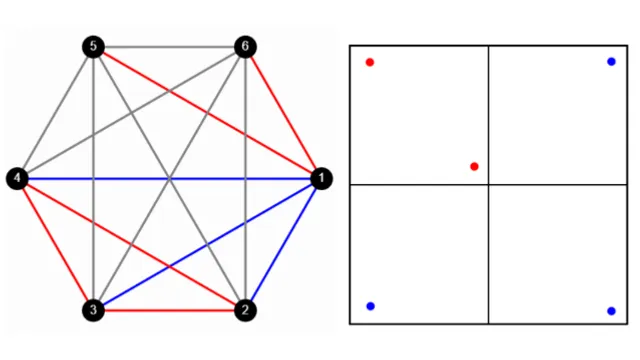
The Pigeonhole Principle : Obvious… But Is It?
This exposition explores the Pigeonhole Principle, a deceptively simple yet remarkably powerful tool in discrete mathematics. Through intuitive examples and real-world applications, the document illustrates how this principle guarantees the existence of patterns, repetitions, and collisions in settings ranging from birthday matches and number theory to geometry and graph theory. The project emphasizes the role of the Pigeonhole Principle in non-constructive existence proofs and highlights its surprising reach in mathematics and computer science, all while celebrating the elegance of inevitability in constrained systems.
Rank 31

You’re Not Cleared to Read This (Unless You Understand Lattices)
This article explores how a simple mathematical structure, the lattice, plays a powerful role in computer security. Starting with the idea of partially ordered sets (posets), it builds up to how lattice theory governs information flow through real-world systems like SELinux and the Bell-LaPadula model. Through a story involving a spy, a top-secret document, and the rule of “no write down,” the post shows how math can enforce trust, block leaks, and even help compilers catch privacy bugs before code runs. Blending visual intuition, accessible math, and real-world relevance, this post reveals how the invisible structure of a lattice quietly keeps our secrets safe.
Rank 31

Every day relativity. Time contraction in your daily commute
As inconvenient as traffic is, it also creates some interesting features that could be the closest, us mortals, can be to experience time relativity. In a very lose use of the concept, it's as if time expanded and dilated; we can leave 5 minutes later and arrive 10 minutes later, and also leave 10 minutes later and arrive almost on time.
This is explained first by an introduction to some basic concepts of set theory, namely: injection, surjection and bijection. These serve to prove the core idea of the post, and along the way it allows to introduce briefly how the cardinality of infinite sets can be compared (as well as the counter intuitive results we get when we apply this to the natural numbers).
Then, the argument is made more concrete by showing an example of mathematical modelling applied to traffic. The idea is to present it in a way that makes the reader think they could've done it themselves (although this will vary on the level of familiarity they have with math). Also, it allows to introduce the bell curve from a different perspective than the common statistical one.
The post sacrifices rigour in favour of eliciting interest in the reader. The goal is to provide new perspectives, ideas, or reasons to further research the topics discussed, and let the reader find in that research the precision that's missing here.
Rank 31

Korean Names Combinatorics
This is a small interactive webapp that covers a simple combinatorics problem in a journey / story-style fashion. It should be easily digestible for almost anyone since it doesn't cover any advanced mathematics, and it has a few small interactive elements that the viewer / user can play with.
It gives a small visual understanding of how to calculate total combinations between independent options, and then applies that to a question on Korean names - since it might intuitively seem like there aren't a lot of such names, but it might be surprising to see how fast such numbers grow in combinatorics, depending on the viewer / user's familiarity with the topic.
Rank 31
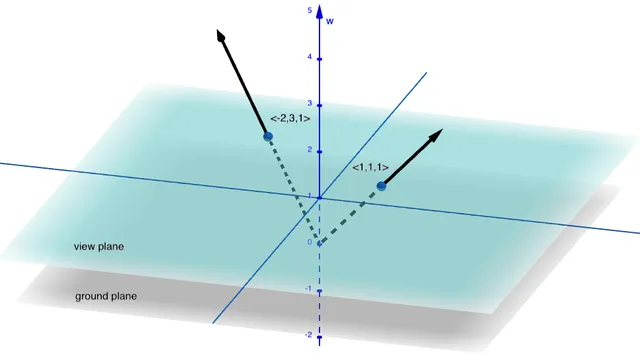
Everything* you need to know about (the math behind) 3D Graphics Programming you can learn from the equation x=2
Explores some of the basic ideas of projective geometry in one and two dimensions to help build intuition for the math behind 3D graphics. Aimed at hobbyist programmers/game developers and upper level high school or university undergrad students who want to know more about where those funny coordinates with an extra dimension come from and how they might be useful beyond just translation matrices.
Rank 32
If LLMs Are Just Matrix Multiplications How Come They Feel So Smart
Linear algebra may seem abstract, yet it now drives chatbots that write poetry, summarize articles, and debug code with human-like ability. This leap — from earlier models limited to narrow tasks like recognizing cats in images to today’s systems that respond with human-like clarity and context — did not come from adding layers of complexity. It came from applying a few simple ideas in linear algebra.
The goal of this tutorial is to make those ideas explicit and show how they yield text that tracks meaning in context. Most tutorials simply regurgitate the “how” of attention: they parade Q, K, V matrices, softmaxes, and positional encodings, then ask readers to imagine that the numbers somehow “focus” on the right words.
In contrast, we emphasize the why — the concepts that make these systems respond like humans. We start with toy examples small enough to make the math visible, showing how simple co-occurrence counts hint at meaning (river pairs with water, not loan) and how the same ideas extend to context-sensitive interpretation without hand written rules and make systems that sound “intelligent.”
Rank 33
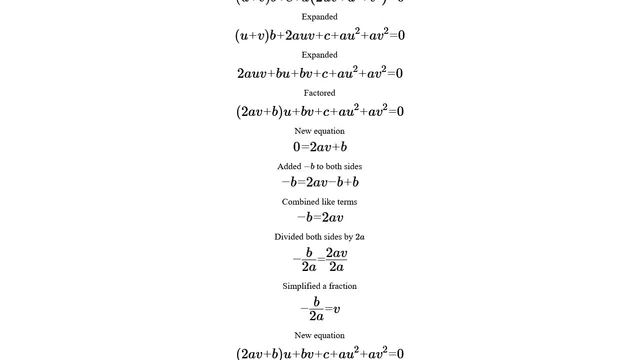
Teaching Maths Using Computer Algebra
This entry is about how I use a computer algebra system (CAS) to help students learn mathematics. I describe in detail how I introduce the topic and how the CAS is useful for students to learn algebra. The CAS differs from others by requiring students to make all of the choices to achieve their goal without the risk of performing a rule incorrectly.
The following links are the entry, they are identical but hosted on different servers in-case one goes down:
https://mathsfromnothing.au/teaching-maths-using-computer-algebra/
https://mathsfromnothing.cf/teaching-maths-using-computer-algebra/
Feel free to explore my other pages but they are not part of the submission.
Rank 34

Cookie Clicker Ultra
What is the largest natural number you can imagine? A web-based game about large numbers. Tested on desktop in Chromium & FIrefox, not supported on mobile.
For reviewers: Finishing the game can take over an hour, so if you don't have the time, you, open the Debug Mode to get the idea about the full gameplay (it allows skipping some challenges). Press "Shift-D", and enter the password "goodkeks".